Solana news: Solana Faces Critical Support Test as $83 Trapdoor Looms
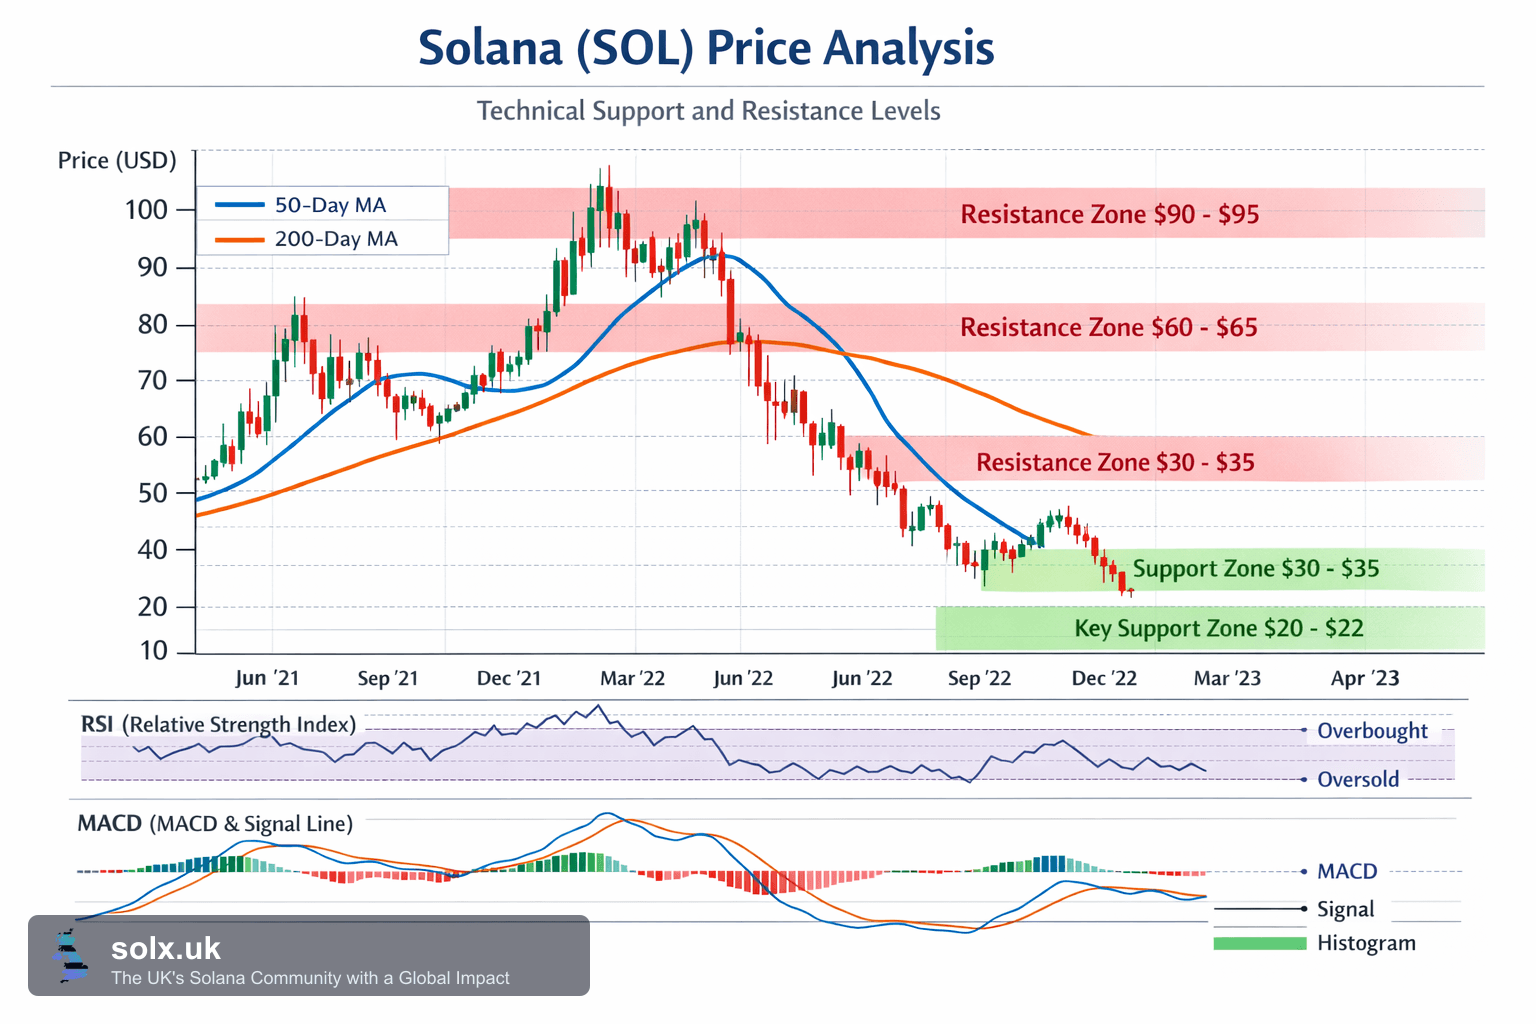
Solana Approaches Key Support Level
Solana (SOL) has experienced a notable decline, dropping approximately 15% since its recent peak in May. The price now hovers near $84.80, with technical indicators and on-chain data suggesting increased risk of further downside.
Bearish Technical Signals Stack Up
Recent trading activity shows two significant bearish crossovers in Solana's moving averages. The 20-period Exponential Moving Average (EMA) has crossed below the 50-period EMA, and a second crossover with the 100-period EMA is forming. Additionally, 12-hour selling volume has been rising since mid-May, indicating active distribution rather than a lack of buyers.
On-Chain Data Reveals Weakening Demand
On-chain metrics from Glassnode highlight a reduction in buying pressure. Exchange net outflows, which peaked at over 2.6 million SOL on 14 May, have halved within five days. The cost basis distribution heatmap shows most SOL was acquired above current prices, leaving little demand support below the $83 level.
Key Price Levels to Watch
- If Solana closes below $83.38, it could quickly drop to $81.37 or even $76.70, as there are few holders to defend these levels.
- To regain strength, SOL must reclaim $87.40, which aligns with a major cost basis cluster.
- Further bullish momentum would require a move above $96.77 and $98.39, currently out of reach without a significant shift in market flows.
Why This Matters for the UK Audience
Solana's price volatility and technical breakdowns are relevant to UK traders, investors, and builders monitoring market risk and liquidity. Understanding these levels can inform trading strategies and risk management, especially as Solana remains a popular blockchain for UK-based projects and users.